class: center, middle, inverse, title-slide .title[ # Algorithms and digital traces: <br>The case of Google trends ] .author[ ### David Garcia <br><br> <em>University of Konstanz</em> ] .date[ ### Social Media Data Analysis ] --- layout: true <div class="my-footer"><span>David Garcia - Social Media Data Analysis</span></div> --- # Announcements - This year we won't use Discord for discussions (ignore older version of these slides) - We will use the forum on Github: ## https://github.com/SMDA-2025/forum/discussions --- # Outline ## 1. Search data: Google trends ## 2. Measuring temporal orientation with Google trends ## 3. Correlating economic development and temporal orientation ## 4. The parable of Google Flu trends --- # Google Trends Google Trends is a website hosted by Google that allows you to get a measurement of Google search volume for a term <center> <img src="EU.png" alt="" width="900"/> </center> --- # Searching for various trends  --- # Exporting data  --- # Export file format  --- # Comparing regions A lower panel shows a comparison between countries or between regions within the country you filtered for.  --- # Exporting map data  - Check "Include low search volume regions" --- # Export file format for maps  --- ## Disambiguating queries across languages  --- ## Temporal orientation with Google trends ## 1. Search data: Google trends ## *2. Measuring temporal orientation with Google trends* ## 3. Correlating economic development and temporal orientation ## 4. The parable of Google Flu trends --- # Time, culture, and the economy What is the relationship between culture and the economy?  --- ## Long-term orientation and economic development > **Long-Term Orientation (Geert Hofstede)** Long-term oriented societies believe that the most important events in life will occur in the future; short-term oriented societies believe that those events occurred in the past or take place now. .center[] --- # Temporal orientation and Google Trends .center[] [Quantifying the Advantage of Looking Forward. T. Preis, S. Moat, E. Stanley, S. Bishop. Scientific Reports (2012)](https://www.nature.com/articles/srep00350) --- ## Measuring the Future Orientation Index [Pres et al. 2012](https://www.nature.com/articles/srep00350) proposed a way to measure how much a society looks towards the future with Google Trends, the Future Orientation Index (FOI). The FOI for a country *c* on year *y* is calculated as: .center[ `\(FOI_{c,y} = \frac{G(y+1,y,c)}{G(y-1,y,c)}\)` ] where `\(G(y_1,y_2,c)\)` is the Google Trends volume for searches for year `\(y_1\)` during year `\(y_2\)` from country `\(c\)`. The FOI measures the ratio of search volume from a country for next year divided by the search volume for the previous year in the same country. --- # Example of trends for FOI .center[] --- # Example of trends for FOI .center[] --- # The World Bank Development Indicators <center> <img src="worldbank.png" alt="" width="900"/> </center> http://data.worldbank.org/ --- ### Example: Life expectancy and economic development <center> <img src="GapMinder.png" alt="" width="800"/> </center> https://www.gapminder.org/ --- # Searching for WDI Indicators <center> <img src="WDIinternet.png" alt="" width="1000"/> </center> - You can search for indicators at http://databank.worldbank.org/wdi - Go to the left panel and to the "Series" tab to search - Press the "i" button to get more information, including the standard name --- ## Economic development and temporal orientation ## 1. Search data: Google trends ## 2. Measuring temporal orientation with Google trends ## *3. Correlating economic development and temporal orientation* ## 4. The parable of Google Flu trends --- # Some univariate statistics notation - `\(X\)` is a random variable - In data: `\(X_i\)` is the value of the variable for entry `\(i\)` - For example the GDP of a country - `\(E[X]\)` is the expected value of `\(X\)` - We estimate the expected value as the mean of `\(X\)`: `$$\mu_X = \frac{1}{N}\sum_i X_i$$` - `\(N\)` is the number of data points, for example the number of countries --- # Some more univariate statistics notation - `\(V[X]\)` is the variance of `\(X\)` - We calculate it as the expected squared difference to the mean X: `$$V[X] = \frac{1}{N}\sum_i (X_i - \mu_X)^2$$` - It is measured in squared units of `\(X\)` - `\(\sigma_X\)` is the standard deviation of X - `\(\sigma_X = \sqrt{V[X]}\)`, which is convenient because it measures dispersion in the same units as `\(X\)` - in R you can calculate it with the function sd() --- ## Pearson's Correlation Coefficient `\(\rho(X,Y)\)` > **Correlation:** Linear association or dependence between the values of variables `\(X\)` and `\(Y\)` - If `\(X\)` and `\(Y\)` are independent, they satisfy that the expectation of the product equals the product of expectations: `$$E[XY] = E[X]E[Y]$$` - The principle: correlation as the deviation from `\(E[XY] − E [X]E[Y] = 0\)` - The absolute value of this difference can be at most `\(\sigma_X\sigma_Y\)` - `\(\rho(X,Y)\)` rescales the difference to be between −1 and 1 `$$\rho(X,Y) = \frac{E[XY] − E [X]E[Y]}{\sigma_X\sigma_Y}$$` --- ### Some examples of Pearson's Correlation Coefficient  --- 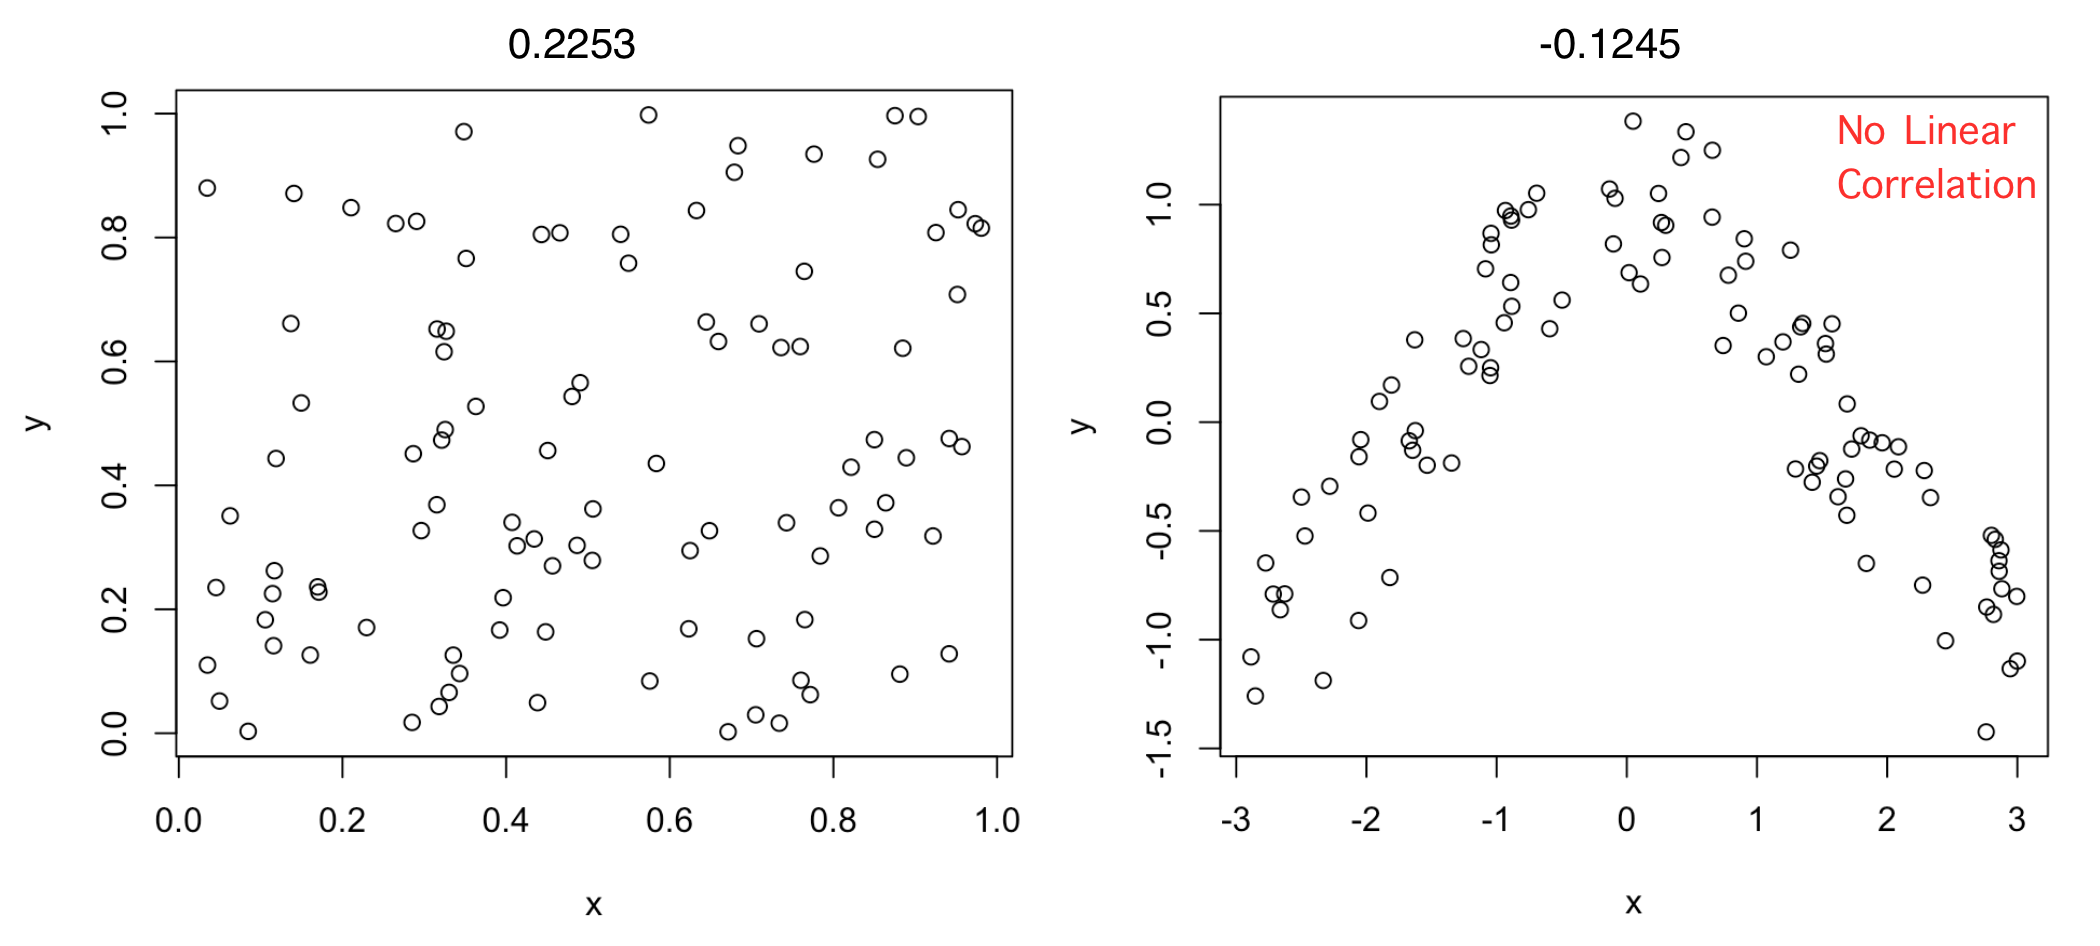 Independent variables will have a correlation close to zero, but a correlation close to zero does not mean independence --- ## Anscombe's quartet ( `\(\rho=0.816\)` ) .center[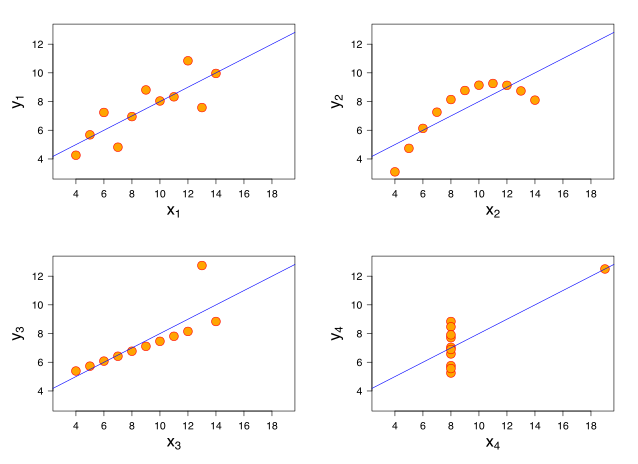] --- ## The Datasaurus dozen .center[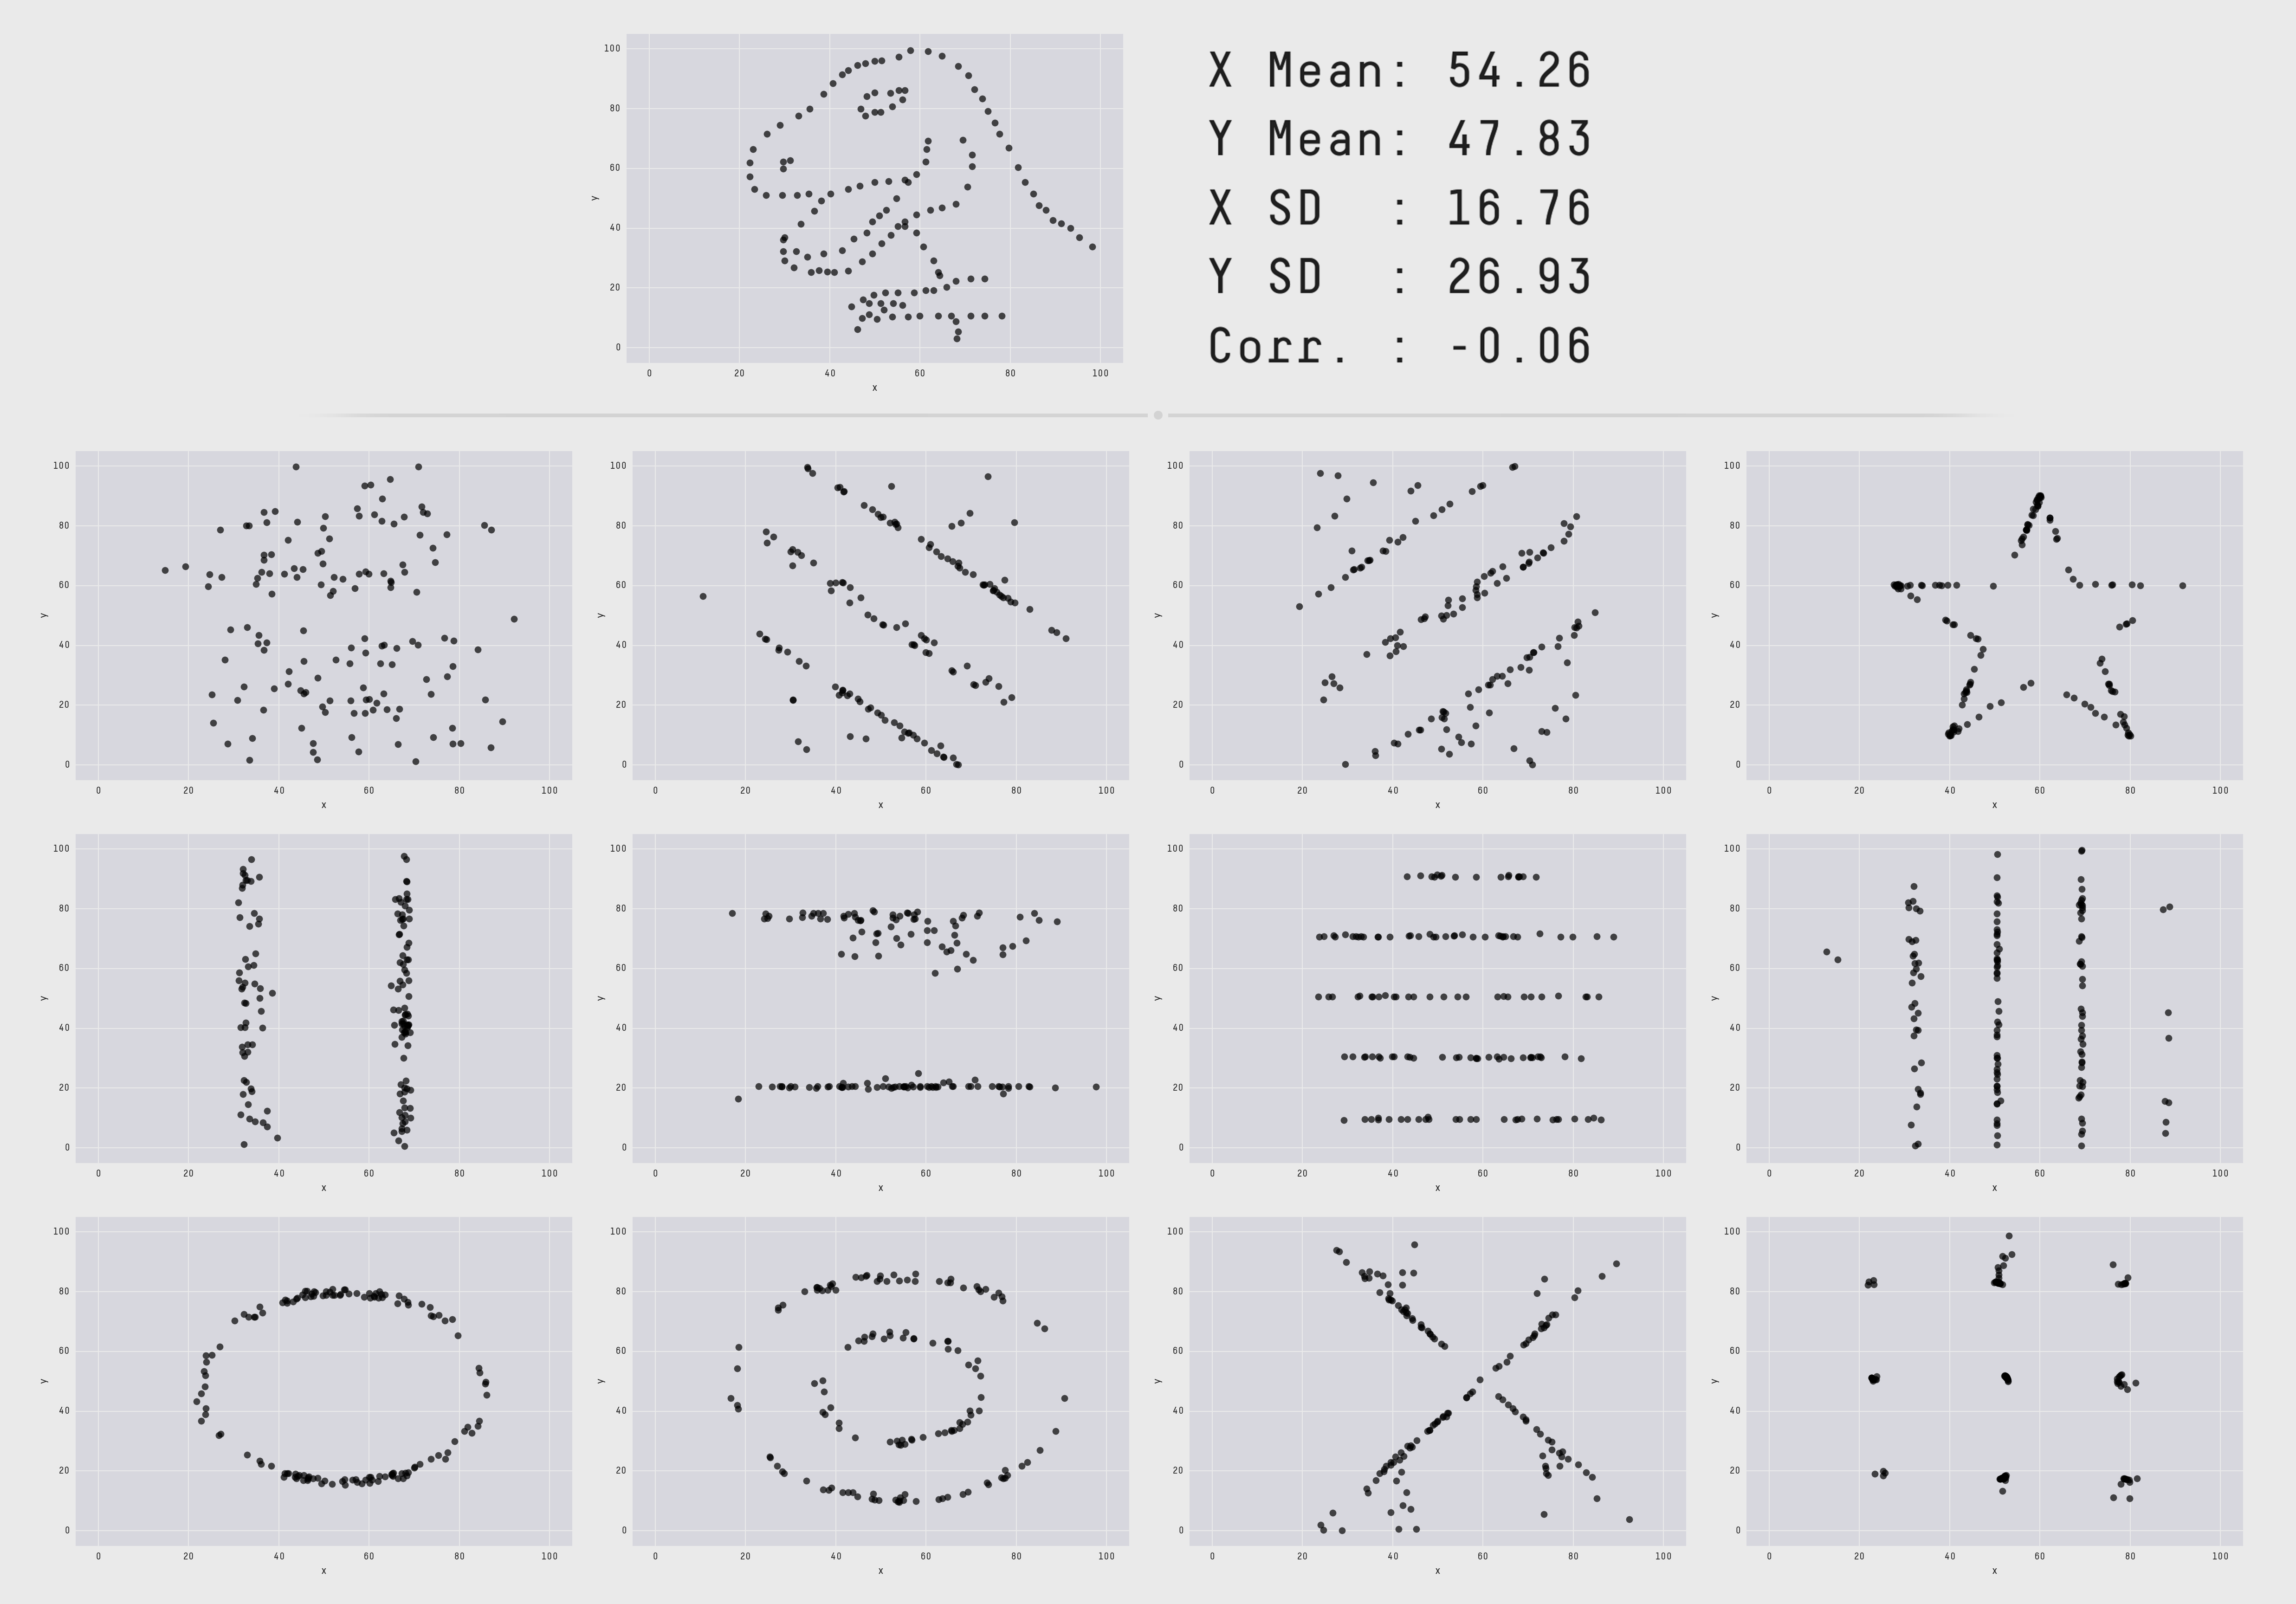] --- # Correlating the FOI and GDP per capita 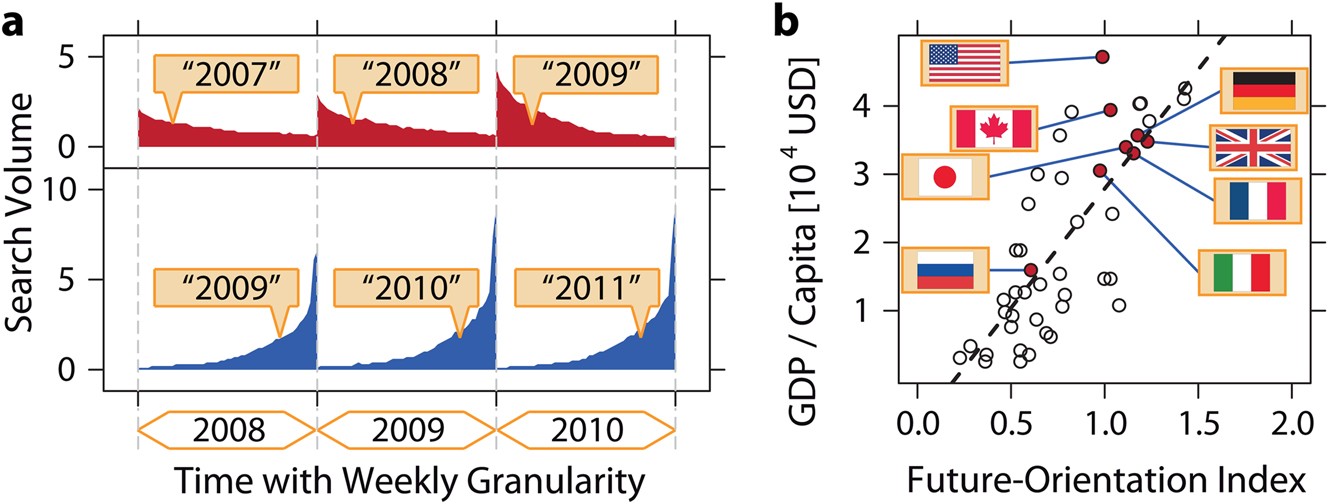 .right[Pearson correlation coefficient = 0.78] --- # The parable of Google Flu trends ## 1. Search data: Google trends ## 2. Measuring temporal orientation with Google trends ## 3. Correlating economic development and temporal orientation ## *4. The parable of Google Flu trends* --- ## Nowcasting flu incidence with Google Trends <div style="float:right"> <img src="GoogleFluTrends.jpg" alt="Data Science discipline Venn diagram" width="500px"/> </div> **Nowcasting** is predicting the present. It provides an estimation of the value of a quantity based on signals that appear at the same time. Google Flu Trends aimed at nowcasting influenza-related physician visits based on Google search volumes. As reported in the [Nature paper](http://www.nature.com/nature/journal/v457/n7232/full/nature07634.html), Google Flu Trends achieved a high weekly accuracy between 2003 and 2008. The figure shows the nowcasting result of Google flu trends. CDC data is published with a delay of two weeks. --- ## When Google Flu Trends Stopped working  During the flu season of 2012/2013 Google Flu trends started overestimating the number of cases. [The Parable of Google Flu: Traps in Big Data Analysis. D. Lazer, R. Kennedy, G. King, A. Vespignani. Science (2014)](https://gking.harvard.edu/files/gking/files/0314policyforumff.pdf) --- # Comparing GFT with autoregression Google flu: `$$flu_t = gft_t$$` Autoregressive model: `$$flu_t = \beta_0 + \beta_1 flu_{t-2} + \beta_2 flu_{t-3} + \epsilon$$` Combined model: `$$flu_t = \beta_0 + \alpha gft_t + \beta_1 flu_{t-2} + \beta_2 flu_{t-3} + \epsilon$$` (note: More details on regression models in the next lectures) --- # Which model is better? - Approach 1: explained variance - Correlation coefficient between predictions and empirical values - Coefficient of determination `\(R^2 = 1 - \frac{\sum_i \epsilon_i^2}{\sum_i(y_i - \overline y)^2}\)` - Approach 2: likelihood-based metrics - Likelihood `\(\hat L\)`, probability of the observed data ( `\(x\)` ) given the model and its parameter values: `\(\hat L = p(x | \hat \Theta, M)\)` - Bayesian Information Criterion: `\(k * ln(N) - 2 * ln(L)\)`, where `\(N\)` is the number of data points and `\(k\)` the number of parameters of the model (note: More details on regression models in the next lectures) --- # GFT versus autoregression .center[] - Autoregressive model with two-week old data has correlation 0.86 - GFT had 0.94, Autoregressive model with last week data has 0.95 - [Predicting consumer behavior with Web search. S. Goel, et al. PNAS (2010)](https://www.pnas.org/doi/10.1073/pnas.1005962107) --- ## Algorithms and interfaces in digital traces Algorithmic suggestions (terms to search, people to friend), shape the data and might not be possible to identify in the traces .center[] [Bit By Bit: Social Research in the Digital Age - Algorithmically Confounded. Matt Salganik (2018)](https://www.bitbybitbook.com/en/1st-ed/observing-behavior/characteristics/algorithmically-confounded/) --- ## Where Google trends works: consumer trends .center[] --- # Comparing models in various cases .center[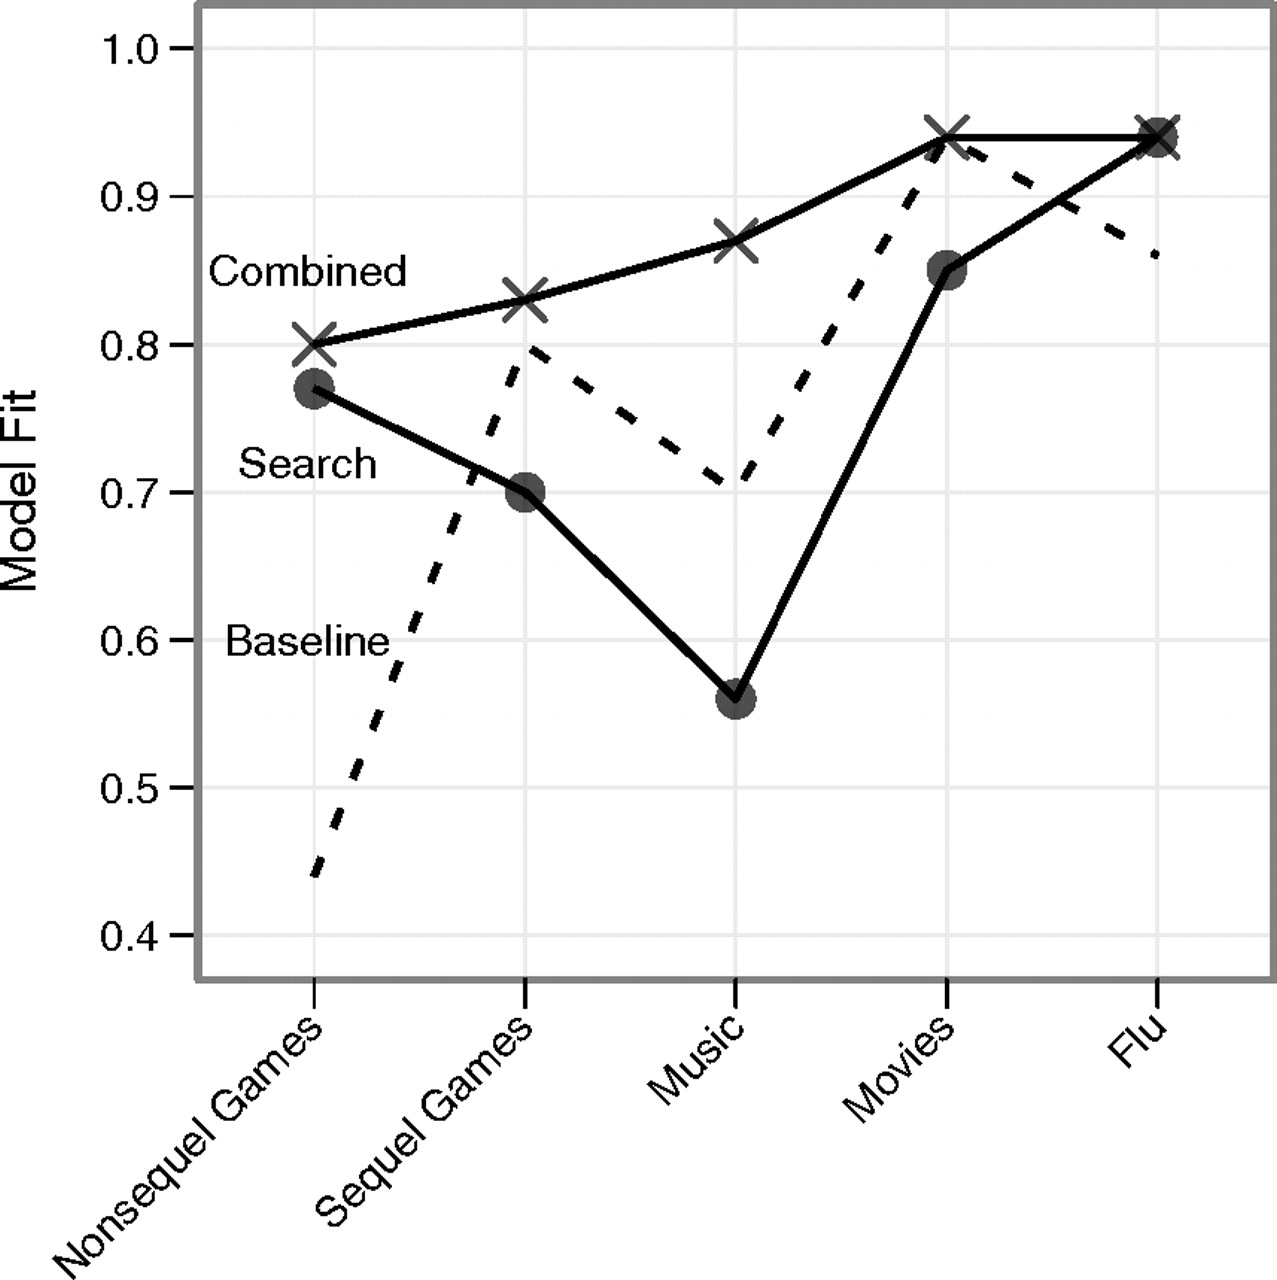] --- # Big Data Hubris .center[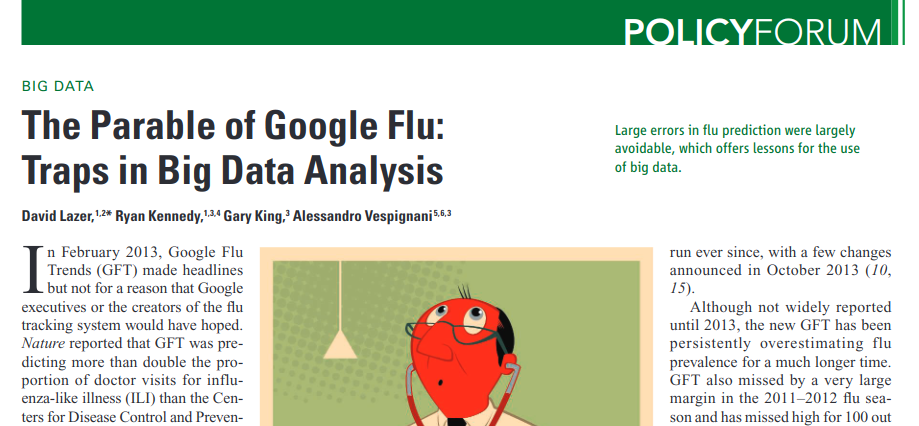] Google Flu Trends is an example of **Big Data Hubris**: ”The often implicit assumption that big data are a substitute for, rather than a supplement to, traditional data collection and analysis” [(Lazer et al, Science, 2014)](http://science.sciencemag.org/content/343/6176/1203) > Take home message: **All data is better than Big Data** --- # Summary - **Introduction to Google trends** - Searching trends across time and regions in a comparative way - A black box with lots of known unknowns - **Temporal orientation and Google trends** - The interplay between culture and the economy - The Future Orientation Index - Correlating the FOI with GDP - **Google Flu trends** - When Google trends started overestimating flu incidence - Big data models need to be compared with standard social science models - Digital traces are not made for research: algorithmic distortions